The stock market has been remarkably resilient so far in 2023 despite a steady stream of challenging news. Whether it has been persistently high inflation readings, a Federal Reserve continuing to raise interest rates longer and farther than expected, a set of sudden bank failures, or the lingering threat of arguably the most anticipated economic recession in history, the U.S. stock market as measured by the S&P 500 has held its ground and found the strength to push to the upside. With the October 2022 lows increasingly fading into memory, it is reasonable to wonder whether the worst of the ongoing bear market is now behind us. Unfortunately, flashing lights on the economic and market dashboard suggest that more stock market turbulence may lie ahead.
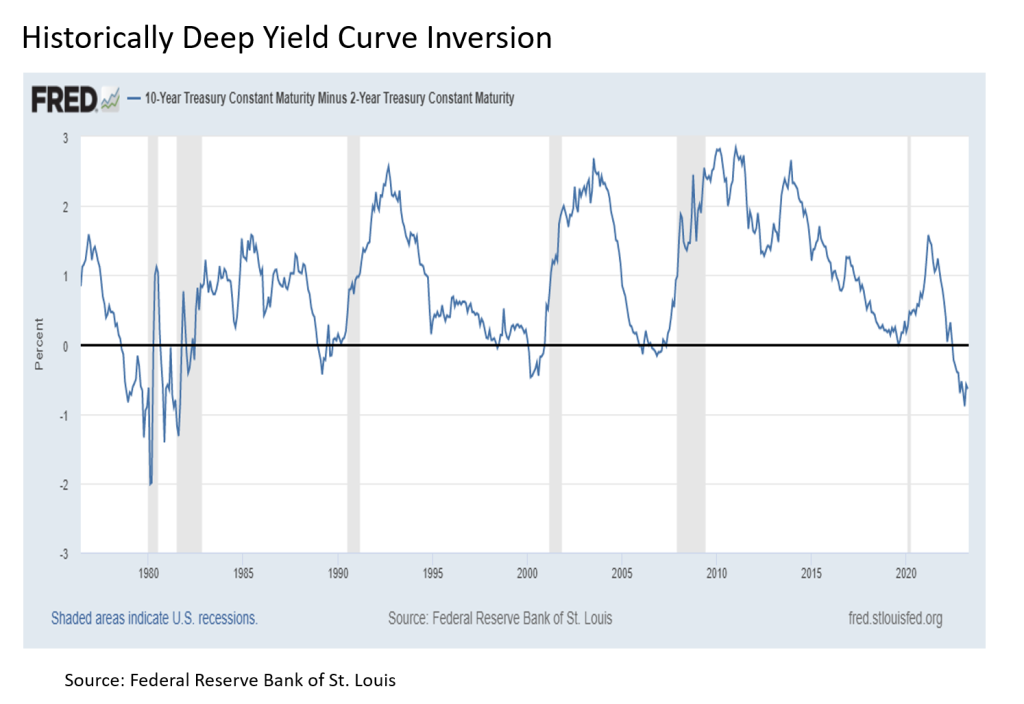
Epic inversion. The first flashing light that simply cannot be ignored is the inverted U.S. Treasury yield curve. Why is this so significant? Because in the 110 years since the advent of the U.S. Federal Reserve, almost every time the Treasury yield curve became inverted with longer dated Treasuries (i.e. 10-year, 30-year) yielding less than their shorter dated counterparts (3-month, 2-year), the U.S. economy has subsequently fallen into recession and the U.S. stock market has entered into bear market territory. What is particularly notable about today’s inversion is that it is the deepest in more than forty years, which hints that the recession ahead may be a bit longer and deeper than usual.

Still pricey. Now the bullish among us could certainly make the argument that much of the anticipated economic weakness may already be reflected in the current bear market that began at the start of 2022 and stripped as much as -27% of the value off the S&P 500 peak-to-trough along the way. This may very well be true, but a couple of key facts favor the bearish side of the argument. First, corporate earnings remain at the high end of the historical range, and with profit margins already falling and an earnings biting recession still expected in the coming quarters, corporate profitability likely has quite a bit further to shrink in the current cycle. Second, the price-to-earnings (P/E) ratio on the S&P 500 remains elevated at a very unrecession like multiple north of 23 times earnings. Historically, the 12 to 14 times earnings range has marked recent past bear market bottoms, and the combo of an already high “P” facing the prospects of a potentially much lower “E” is another flashing light.
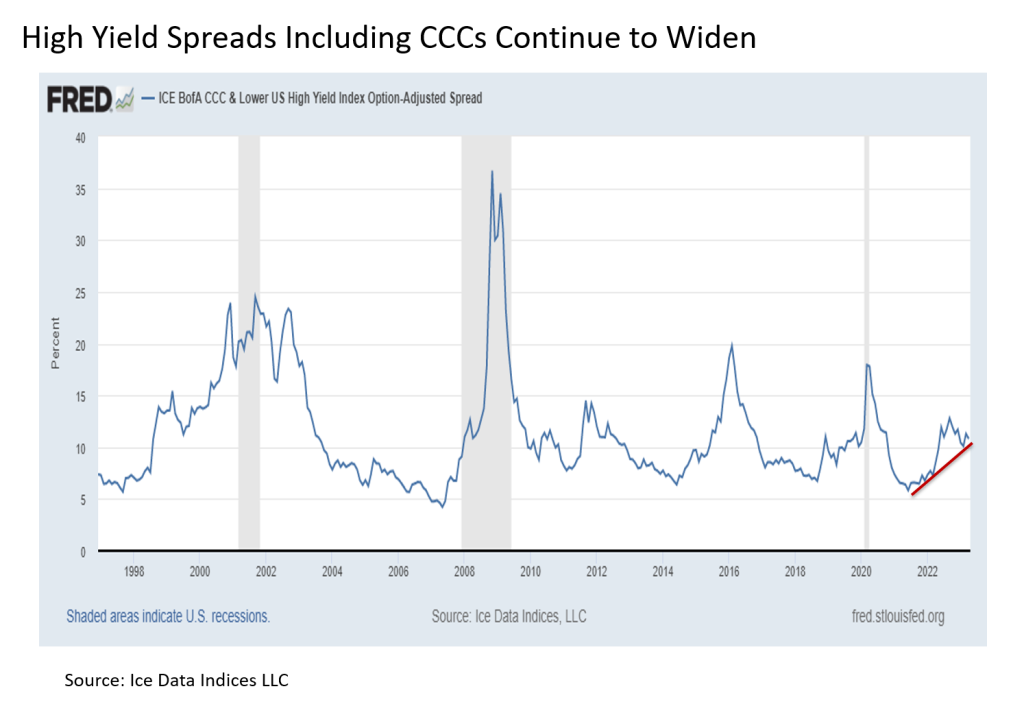
Widening spreads. A third flashing light is the widening spread required by investors to own riskier securities such as high yield corporate bonds versus safe haven U.S. Treasuries. During much of the post financial crisis period save the energy sector related challenges of the mid-2010s, these spreads were historically tight. This implied that investors required a relatively small yield premium to take on the default risk of owning debt from issuers that had a measurable chance of not being able to repay these loans in the future. But since the start of 2022, these spreads have widened measurably, which has historically been a predictor of an economic recession ahead and an accompanying stock bear market. This has been particularly true of CCC-rated or lower high yield bonds, which tends to lead even the broader high yield bond market. Although they have tightened somewhat in recent months, which is certainly a constructive sign, the trend remains biased toward the further widening of spreads in the months ahead, particularly if fundamentally challenged banks increasingly tighten lending standards as anticipated going forward.

Careful what you wish for. The last flashing light for this bulletin (I have others, but I’ll return with these depending on how things unfold in the coming weeks) is related to expectations around monetary policy from the U.S. Federal Reserve. With less than two weeks to go before their next meeting, it appears highly likely based on the CME FedWatch Tool that the Fed will raise interest rates by a quarter point at their upcoming May 3 meeting. Looking further ahead to their next FOMC meeting in June, while the market is pricing in the chance for another quarter point hike, latest probabilities suggest that the May 3 rate hike may be the last from the Fed in the current cycle.
What is much more notable is what we find when looking further ahead to second half of 2023 and into 2024. As the year progresses, the market is pricing in the meaningful probability for a steady series of rate cuts. By the end of 2023, the market is anticipating at least two quarter point rate cuts, and by the end of 2024 the market is pricing in a 1.5 percentage points reduction in the Fed funds rate.
All of this sounds bullish at first glance. After all, the stock market was all hopped up on zero interest rate policy for more than a decade up until the calendar flipped to 2022, so what’s not to like about the prospects of the Fed getting “back to work” with more easy money policy, right? (I’d answer this question, but that’s a topic/rant for another article).
But here’s the thing. The Fed isn’t likely to simply start cutting rates if the economy and the stock market are chugging along as they have so far this year. This is particularly true as the Fed is still busy trying to treat a scorching case of inflation. Instead, likely the only way the Fed makes a sudden about face and starts cutting interest rates is that the economy and the stock market start to take a sharp and sustained turn to the downside. In short, the Fed’s going to need a good reason to start cutting interest rates, and it does not yet have this reason today. So for those investors that are all whipped up about the idea that the Fed may be cutting rates by 2023H2, remember that we likely first must endure the reason for the Fed to take action on rates in the first place.
Bottom line. Flashing lights continue to signal challenges ahead for the U.S. economy and the stock market. As a result, it remains prudent for stock investors to remain patient and selective as the current cycle continues. On the constructive side, fundamental conditions have become meaningfully more favorable for bonds and gold, which would help to provide a portfolio diversifying offset if stocks took a turn to the downside.
Disclosure: I/we have no stock, option or similar derivative position in any of the companies mentioned, and no plans to initiate any such positions within the next 72 hours. I wrote this article myself, and it expresses my own opinions. I am not receiving compensation for it. I have no business relationship with any company whose stock is mentioned in this article. Investment advice offered through Great Valley Advisor Group (GVA), a Registered Investment Advisor. I am solely an investment advisor representative of Great Valley Advisor Group, and not affiliated with LPL Financial. Any opinions or views expressed by me are not those of LPL Financial. This is not intended to be used as tax or legal advice. All performance referenced is historical and is no guarantee of future results. All indices are unmanaged and may not be invested into directly. Please consult a tax or legal professional for specific information and advice.
Tracking #: 430334-1
