When thinking about diversification, investor minds often focus on the relationship between stocks and bonds. But a variety of other asset classes also exist. One such category is gold.
Quarter century winner. Suppose you were presented with the following question: “what between U.S. stocks and gold has been the best performing investment category over the past 25 years?” Understandably, the answer from most investors would be U.S. stocks. After all, those of us that have been in the investing game long enough can remember like yesterday at the turn of the millennium the dubious “Dow 10000” hats on the New York Stock Exchange trading floor along with the even more notorious Dow 36000 book release (the Dow is on the brink of eclipsing 40000 today) along with the NASDAQ bubble peaking at just above 5000 (its over 16400 today) and the S&P 500 hitting all-time highs of 1553 (it is surging above 5000 today). U.S. stock performance over the last quarter century has been phenomenal.

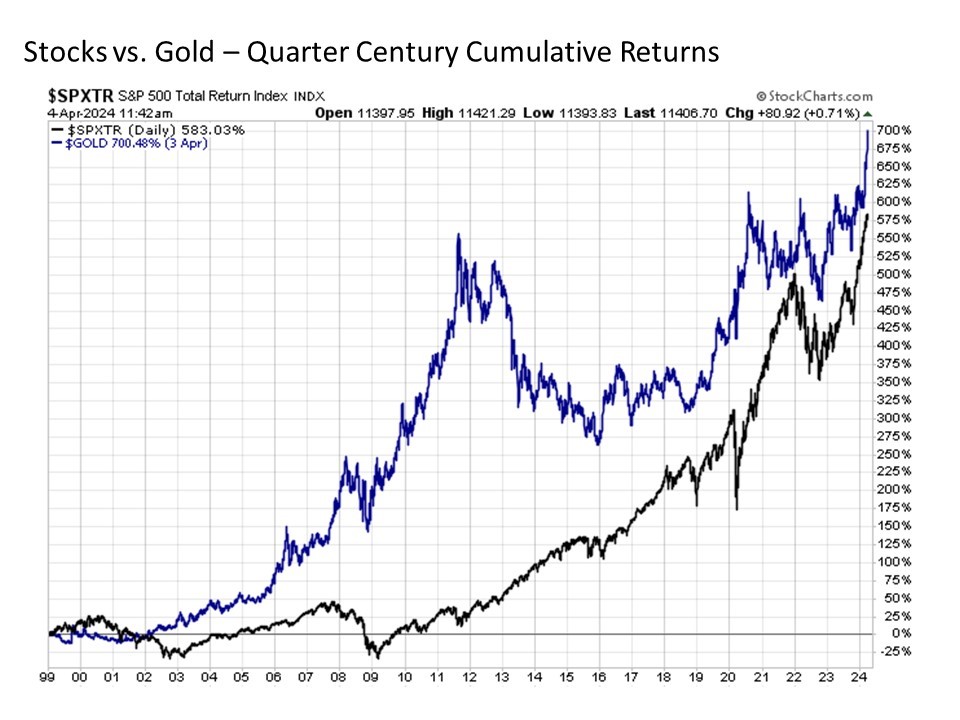
Nonetheless, the answer to the above question is not U.S. stocks. Instead, it is gold. Since January 1999, gold has generated a cumulative return of +700% through today versus the +583% total return for U.S. stocks as measured by the S&P 500 over this same time period. Not only is gold the winner, the margin of victory is not even close at triple-digits.
About diversification. But the key from the chart above is not about the cumulative return experienced by either category over the past 25 years. Regardless of your choice, both categories performed well over this long-term time period. Instead, the far more important point is the vastly differentiated path that these two asset classes traveled along the way to arrive at their respective end points.
Consider the period from 2002 to 2012. While stocks were largely dead money during this time period in the wake of the double bubbles of 2000-02 and 2007-09 along the way, gold surged relentlessly to the upside.
Consider the period from 2013 to 2018. While gold was getting routed, stocks were exploding to the upside on a wave of sufficiently sluggish economic growth and consistently easy monetary policy flowing from the U.S. Federal Reserve.
And consider the period from 2019 to the present, where both stocks and gold have been advancing strongly to the upside with their own respective fits and starts along the way.
This is what is known as being uncorrelated, and is a key principle to portfolio diversification over the long-term. Regardless of whether stocks are zigging or zagging at any given point in time, gold is following its own largely independent path. In other words, if either category heads sharply south at any given point in time, the other category has the independent ability to potentially pick up the slack.
Uncorrelated. Let’s take a brief dip into the statistics. The correlation of two assets is measured on a scale between -1.00 to 0.00 to +1.00.
If the correlation reading is positive, it means two assets are likely to move in the same direction over time. The higher the positive reading toward +1.00, the more positively correlated two assets are. For example, while a core U.S. bond strategy has a low positive correlation at +0.21 with U.S. stocks (this is a fairly good diversification reading), the reason that many say high yield bonds trade more like stocks is because they have a relatively correlation to the S&P 500 of +0.74.
Conversely, if the correlation reading is negative, it means two assets are likely to move in the opposite direction over time, with the higher the negative reading toward -1.00, the more negatively correlated the two assets are. Thinking about the stock/bond relationship, its worth noting that long-term U.S. Treasuries have a low negative correlation at -0.13 with U.S. stocks, thus packing an added portfolio diversification punch relative to a broader core bond strategy for an investment portfolio when stocks are falling (the fact that long-term U.S. Treasuries also have a meaningfully higher standard deviation of total returns than a broader core bond strategy is also an important key from a diversified portfolio construction standpoint, but this is a more in depth discussion for another day).
So what about gold? The yellow metal has a +0.09 correlation to U.S. stocks. The closer the reading to 0.00 between two assets, the more uncorrelated (and independently moving) these two assets are. In short, gold is virtually uncorrelated with U.S. stocks. (Bonus note: gold also has a low positive correlation at +0.22 to both a broader core fixed income strategy as well as long-term U.S. Treasuries – not only is gold essentially uncorrelated with stocks, they are also largely uncorrelated with bonds).
But weight. What else is worth knowing about gold.
First, gold as an investment is not for the faint of heart. It has a price volatility that is more than 10% higher than that of U.S. stocks as measured by the S&P 500, which is a more volatile category in its own right. This volatility can be disquieting, particularly when gold enters into a more price swinging stretch as it has on a number of occasions during its history.
Next, gold is a real asset. It hurts when you drop it on your foot. But it does not generate cash flows and it does not kick off income.
Bottom line. When thinking about broad diversification, the asset class universe is not just limited to stocks and bonds. It also includes a variety of other uncorrelated categories including gold.
Compliance Tracking #: 554159-1
